Just give a try to pixel depth offset.
Tried it already with no luck. At the moment I am trying it on a custom mesh with custom textures with no luck as well, the borders do not seem to work at all:


Looking at some videos with POM+Silhouette, the borders shouldn’t work that way, right?
I attach my material.

[MENTION=329944]Mr. Boat[/MENTION] There is no easy solution for . If you know, where the edge of the mesh is placed in UVs, you could check if coordinates, that POM node outputs, are exceeding a given value. If yes, write 0 to opacity mask, otherwise write 1. method is probably not flexible enough to be actually usable. If you need silhouette on those edges, consider using tessellation. Otherwise, you could try implementing silhouette POM on your own. You would need geometry shader access for that and it is beyond of what can be done in material editor.
That is interesting. I am not aware of any large perf regression with POM but I can check. My gut reaction is that 500 steps is an awful lot and it can make the shader very sensitive to performance. It is possible that some unrelated change in the engine, such as a minor increase in number of temporaries for unlrelated shader options could have reduced how much the gpu can parallelize.
Also, when using very high step counts, texture formats and mip handling can make a huge difference. Just changing the height to be uncompressed can cripple perf. I will have to double check later, but its possible that 4.13 is when POM was changed from using SampleGrad to SampleLevel with mip0 specified. At some point I changed it so that it did SampleLevel because in most test cases it was actually faster and TempAA was doing a better job cleaning things up than semi-accurate mips. It may be that for some textures and materials is backfiring.
@ I think 4.13 uses SampleGrad with shadows enabled and SampleLevel with shadows disabled.
I just checked and 4.12 seems to be the same way. Trying to compare perf now with a high step count material.
Maybe those static switches are somehow forcing POM node to be calculated times 3 ?
They should not be due to the compiler optimizations Rolando did, but that is something to double check.
I was able to reproduce a minor perf difference, at least initially but more testing is required. I used 2000 steps since I have a 980 ti card. In 4.12, the fps was still locked to 120 with 2000 steps but the base pass was averaging 4.5ms. In 4.13, the same material was running at only ~105fps and the base pass was taking 5.5ms so a 1ms increase. is odd since there doesn’t appear to be any difference in the two POM and the cost is also not there if I disable the POM. It could be as I suspected earlier, where adding more variables or execution paths to the renderer has reduced parallelism but its only noticeable in these extreme cases. It could even be a new default project or engine setting but tracking it down could prove challenging.
When I use reasonable step counts (<64), there is no measurable difference between POM in 4.12 and 4.13.
If was a failure to merge the POM between material pins, I would expect far more than 1ms difference when 2000 steps are used.
I’ve checked compiled code and custom expression is correctly called only once in both versions.
Also, there is a slight difference between 4.12 and 4.13 but it can’t be related to POM.
&d=1478387500 please help to identify names of every node, i try to create good pom material that has 4 texture inputs and textures are from freepbr.com
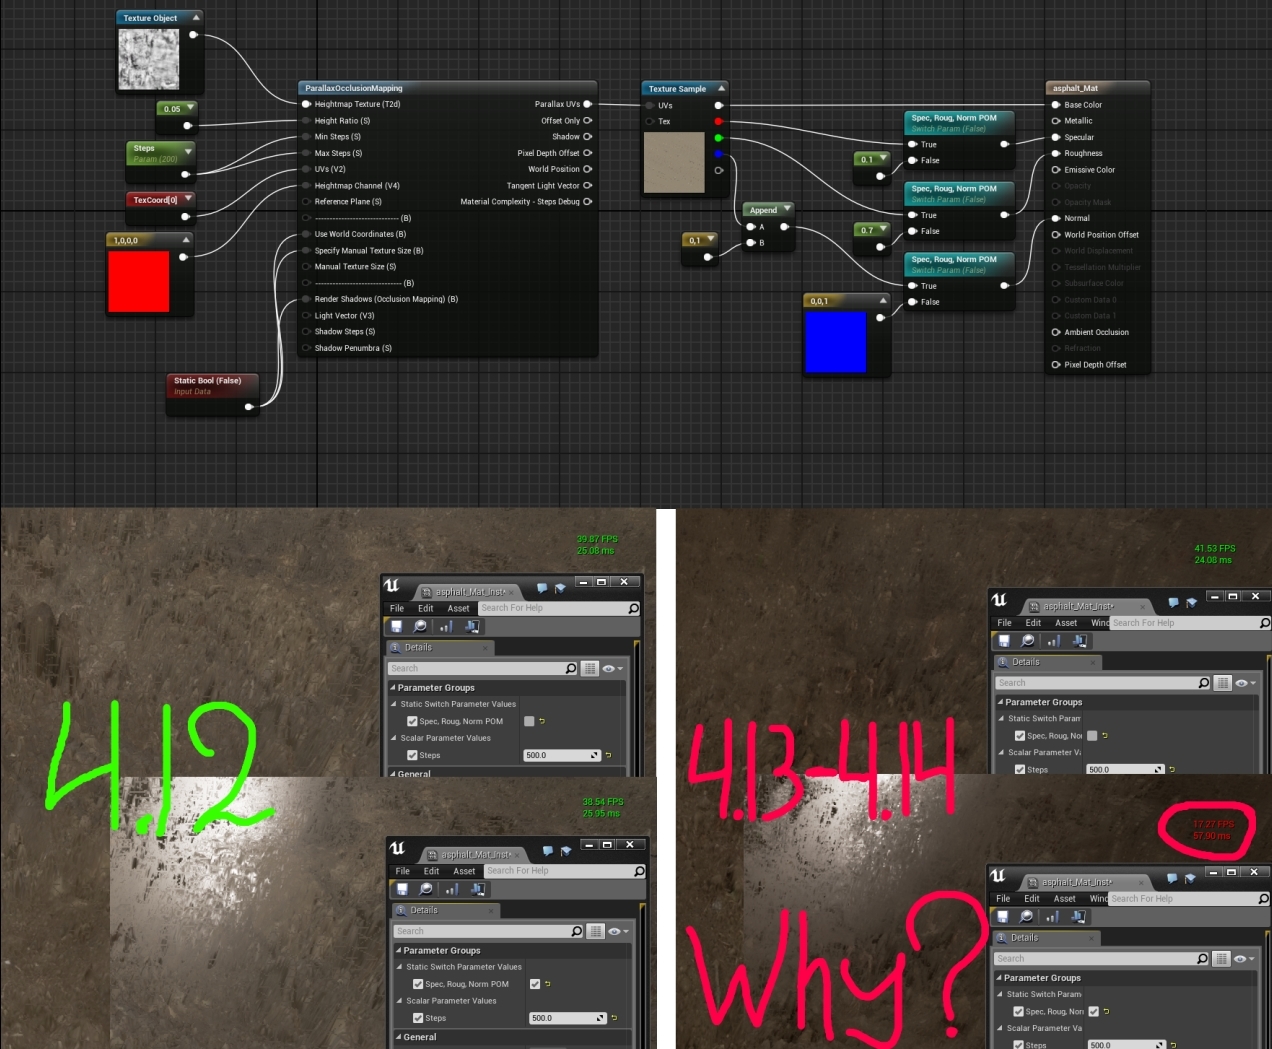
Yes! Sorry, it is only 4.14, not 4.13. So it was before, 4.11-4.12 (IIRC) has been fixed, and now again.
Ah ok. I will double check in 4.14 now, just downloading the public version first.
edit. Ok, in 4.14 I am getting a pretty hefty performance difference. I made a better test material and in 4.13 it was taking 11ms and in 4.14 it is taking 24ms. . It does look to be a failure to merge the input pins based on viewing the shader. I see two copies of the custom expression and both are referenced in the generated shader code.
Btw, great catch! Because of report, bug will most likely be fixed in time for the 4.14.1 hotfix update. Without report it could have gone un noticed and has potential performance implications for the whole engine. Thanks for your diligence!
Thanks for catching , it was a bug introduced from one of the recent material attribute refactors. I’ve submitted a fix ready for 4.14.1.
Does affect for all Custom nodes?
Not quite as it wasn’t custom node specific, but it is a potentially major performance regression for some materials. It affected all cases where a graph section was re-used across multiple material attribute outputs. POM was a good example of because there’s an expensive UV coordinate calculation which is then typically re-used to sample Base Color, Normals, Roughness and other textures.
would explain our performance regression also. We have quite expensive is pixel under water test which is then used to drive wetness which basically affect every attribute in some way.
If you have access and you’re compiling 4.14 yourself you can get latest now and that should include the fix for . Apologies for the inconvenience, hopefully the first revision patch will be out soon.
Link not working.
The link will only work if you have a linked account and already setup your unreal engine source access. Taking the latest from the release branch on should include the change I referenced, but unless you’re already building source or are heavily affected by bug I’d recommend waiting for the first hotfix to release if viable.