I don’t exactly know the best place to post this, I suppose it fits mostly under Content Creation.
On a project I am working on we are suffering insane load times. We have already cut this down by moving some blueprint class references to C++, but there are some areas where we simply don’t know the exact bottleneck.
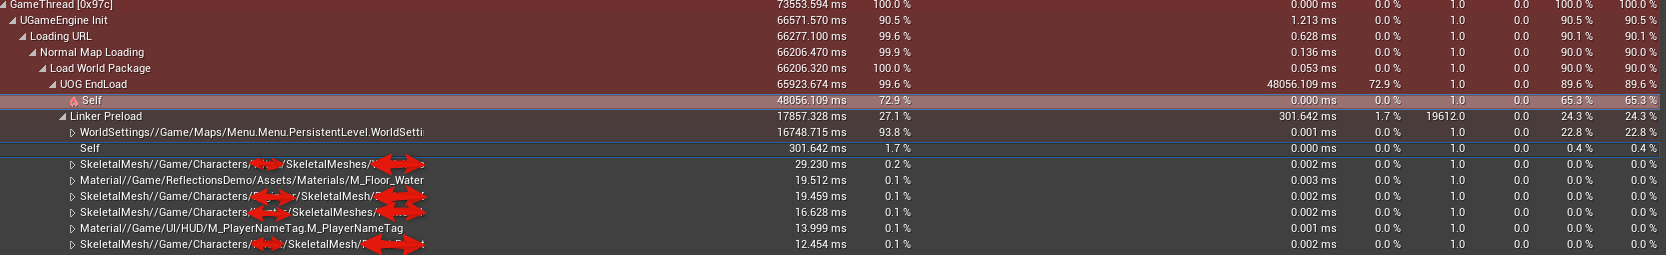
Here is an image of a stat capture taking with -loadtimefile. You will see that Loading URL’s self is taking a significant amount of time without an ability to dig deeper. Looking at the Loading URL scope in code, there is quite a bit of things going on, so any insight would be great.
The map it is loading is a menu map that has nothing in it other than a skeletal mesh and a scene render target.
The map we’re loading into has a plane and a skeletal mesh. The game does have a lot of sizable content however. Also, this load time issue seemed to start happening on transition to 4.6.1 from 4.5.
I added some stat groups inside normal map loading. UOG stands for UObjectGlobals. What I would really like to know now is how can I get logging in the EndLoad’s Self that is similar to the output in the Linker Preload chain? The Linker Preload shows exactly what assets are taking up load time and we’ve been able to cut that down dramatically. We still have some more to cut from our 17 second load time there but at least we know what we are fighting. The UObjectGlobal EndLoad Self though on the other hand is a bit worrysome as that is getting into some complex things that I don’t have enough time to sink my teeth into to figure out how to log in a way to make it as useful as the Linker Preload logging.
Unfortunately this project is under NDA with a publisher so I can’t really post more than this, and I’m working on getting my UDN access resolved as I seemed to have lost it earlier. Until then, best I can do is this.
By adding even more logging and drilling down into the depths of package code, I’ve found my content that was creating the long load times. We’ve been able to cut our load time by half now, which is great.
Now however one of our major bottlenecks is Compile Time in Linker Serialize. Specifically Create Function List. What would be the best and easiest way to cut down these costs?